Reach your devices. Operate the whole fleet.

Connect Linux equipment and the tools your team uses. Monitor devices and services, investigate faults, manage incidents and review security activity. Keep your hardware and software; add releases, offline workflows or a branded customer application when you need them.

See what your team and customers get
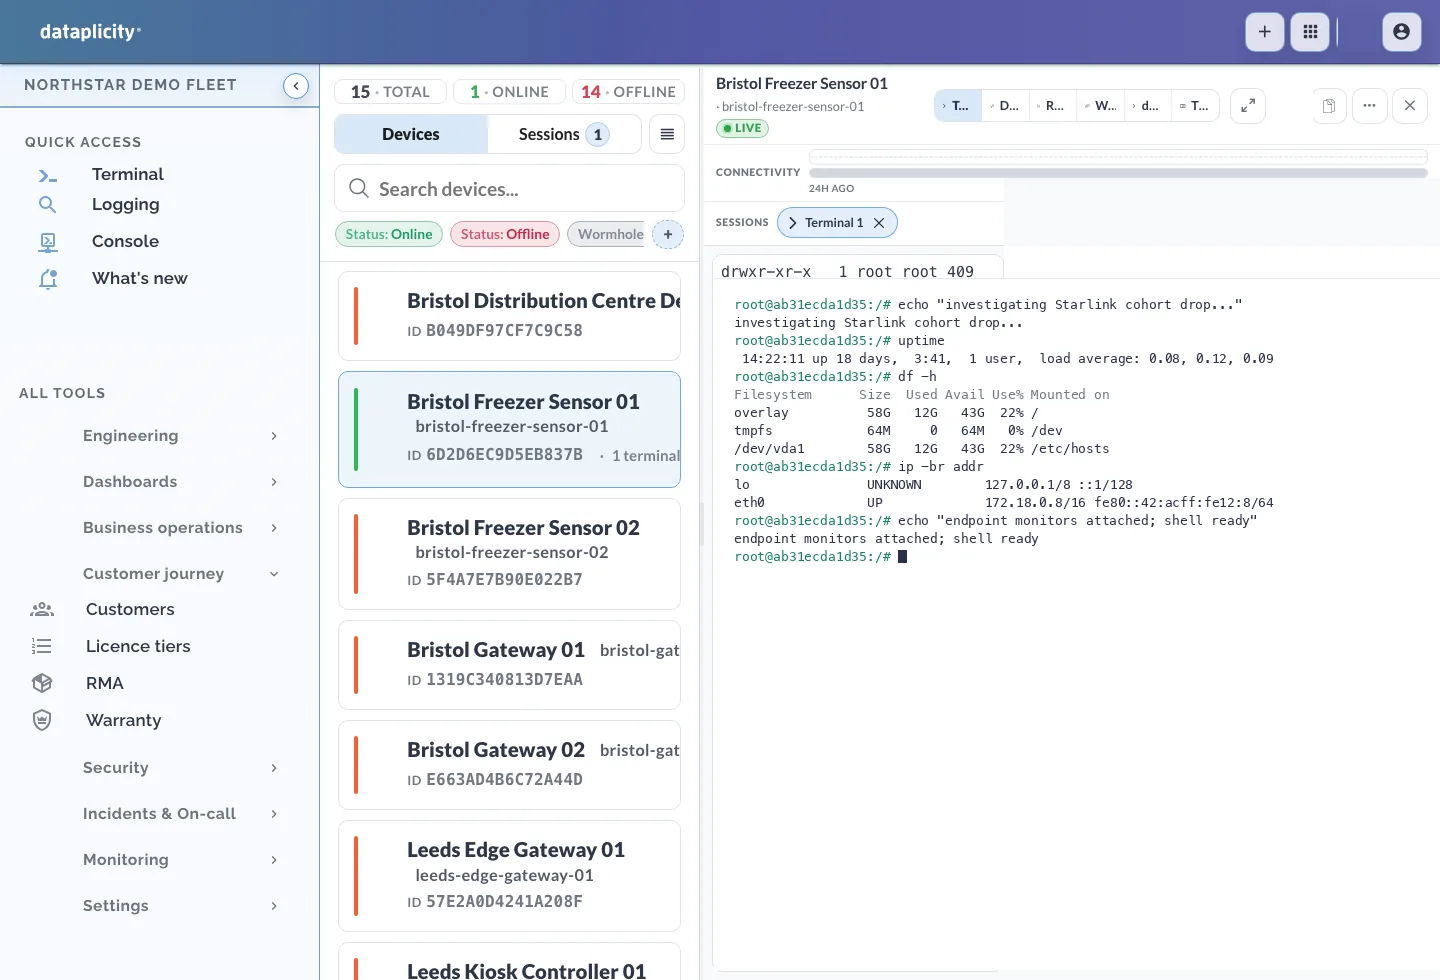
Dataplicity device list beside a selected device and its remote Linux terminal, shown with demo data

Your fleet and a remote Linux terminal in one workspace. Shown with demo data.

Connect one device. Open its terminal.

  1. Keep your product

    Use the Linux device and application you already have, from a prototype to equipment in the field.

  2. Install the agent

    Run the install command on a device you can reach. The agent runs alongside your existing software.

  3. Open Dataplicity

    Once the device connects, open its terminal in your browser and try remote access.

The agent connects outbound. No inbound ports or customer VPN needed; your network must allow the connection.

Not ready to install? Try Device Check, free with no account

Your team needs control. Your customers may need an application.

Operate your Linux devices, build a customer application, or do both.

For your team

Operate your Linux devices

Reach devices, spot unexpected changes and investigate faults with logs and diagnostics.

Use Dataplicity for your engineering and support team. Keep your existing customer application.

Explore remote access & fleet operations
Dataplicity terminal cockpit with fleet device list and a live device shell session

Dataplicity fleet workspace: device inventory and a live Linux terminal.

For your customers

Give customers an application of their own

Let customers see their equipment, check readings and use permitted controls in your brand.

Your team connects the device data and controls. Add schedules, service requests or other workflows as your product needs them.

Explore customer portals & applications
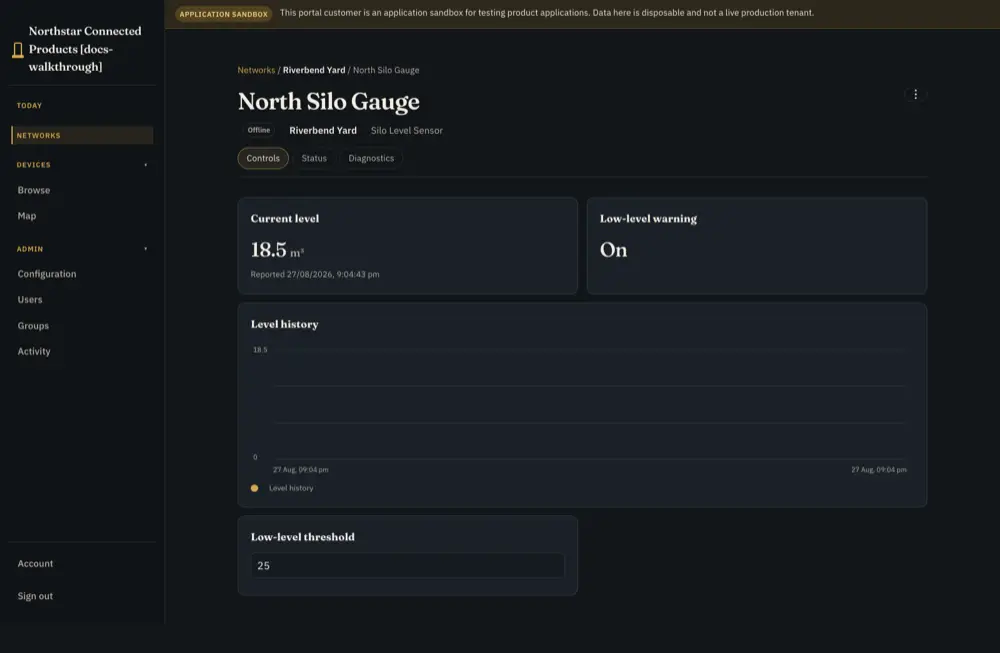
Silo level monitor showing 24 hours of readings declining to 18.5 cubic metres, with a low-level warning and threshold of 25

Example customer application: silo levels, reading history and device controls.

Use either independently, or combine them around the same connected devices.

Keep your product. Add the capabilities it needs.

Start with the job you need to finish. Connect equipment and tools, monitor service health, investigate incidents, secure access, release software or build a customer application. Add the capabilities that serve your product.

Reach and support devices

Reach Linux devices behind customer networks. Investigate with Pulse, diagnostics, collected logs and reviewed AI assistance. Carry fixes into fleet jobs and follow-up work.

Connect your tools to the fleet

Reach permitted device TCP services from a Linux host through stable fleet IPs and private DNS. Control access by device tags and ports.

Secure access and review activity

Bring identity controls, security detections and device-access history into the same operating picture. Keep access scoped to the people and services that need it.

Manage releases when you want to

Fleet operations works with the software and updater you already have. If useful, add managed application releases or RAUC fleet rollouts later.

Keep essential work local

Use explicit Edge execution, selected local data and bounded buffering for products that must tolerate unreliable connectivity.

Give customers an application

Provide scoped device views, records, controls and workflows in your brand while keeping engineering tools with your team.

From fleet signal to response

See the pattern. Bring the right team. Verify recovery.

A connected device can still be unhealthy, and a group going offline can share one dependency. Keep monitoring, access, investigation and security around the same fleet context.

Monitoring, alerts and incidents

Watch devices, fleet groups, heartbeats and services. Configure alert conditions, notification routes and on-call escalation. Keep incident notes, customer updates and availability evidence with the response.

Networking for your own tools

Use a Network Connector on a Linux host to reach permitted device TCP services through stable fleet IPs and private DNS. Control which device tags and ports each host may access.

Security throughout the work

Use identity controls, scoped access, security detections and device-access history. Review who reached the equipment and what access changed as part of the investigation.

All your devices on one ISP are offline. Others are still alive.

Illustrative scenario: gateways using one provider stop checking in together, while gateways on other providers remain online.

  1. Detect the group failure

    Use an ISP-tagged cohort and a fleet offline threshold. Configure an alert rule to raise an incident when the trigger conditions persist.

  2. Compare the healthy fleet

    Check devices outside the cohort, last-seen times and available ISP performance history. Account for missing observations before drawing a conclusion.

  3. Investigate and respond

    Review collected logs, bring in responders, record the evidence and communicate customer impact. Live device access resumes when its agent reconnects.

  4. Verify the whole group

    Track fresh check-ins and recovery conditions. Keep remaining exceptions visible and record the outcome before closing the response.

The pattern points to a shared connectivity dependency to investigate; it does not by itself confirm an ISP fault.

Follow the monitoring and incident workflow →

Network Connector is available on all plans within device and port allowances. The fleet-monitoring and incident suite requires Business+; fleet monitor access also follows the release channel. Fleet SLOs require Enterprise. Pricing

One device looks wrong. Follow it through to the result.

Keep the device, site and operating evidence together as you investigate and act.

Illustrative investigation, not a measured customer result.

Gateway-14North site · 12 comparable gateways · Online
  1. Spot the change

    Pulse flags a gateway whose disk use and installed packages differ from similar devices. Decide whether the difference needs investigation.

    Finding: disk 91% full; packages differ

  2. Inspect the logs

    Open the collected logs for that device and time. In this example, repeated retries are filling a service log.

    Evidence: retries and a growing log file

  3. Reach the device

    Open its remote terminal. Your engineer checks the service and corrects the configuration causing the retries.

    Action: check and correct the service

  4. Check the result

    Review fresh logs and readings. Confirm retries have stopped and disk use is stable before treating the problem as resolved.

    Check: fresh readings; no further retries

If you add a customer application, customers can see readings from this same equipment. Your engineers keep the diagnostics and remote access tools.

Explore fleet operations

One device is enough to try remote access. To evaluate Pulse, connect comparable devices in a Device Class (a group of the same device type) on a paid plan and allow evidence to accumulate.

Start where your product is.

Connect a prototype, prepare your first batch, or add Dataplicity through the installation or update process you already use in the field.

Find your starting point

Try it on a device you can reach.

Prove remote access on one device, then choose the operating capabilities your team needs.